California School Board

Explore the California School Project's PowerBI Dashboard Analysis, delving into student disciplinary actions and their link to academic performance during the 2016-2017 academic year. Interactive visualizations reveal trends, correlations, and insights, aiding educators in targeted interventions. Discover connections, generate reports, and drive positive behavior and academic outcomes.

8/24/20233 min read

Project Overview

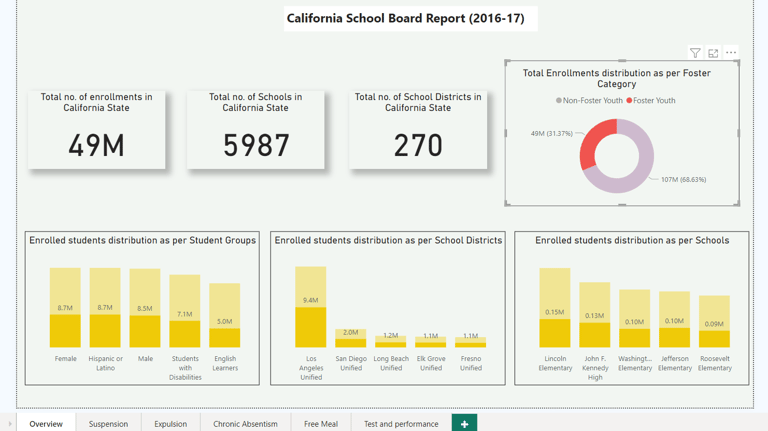
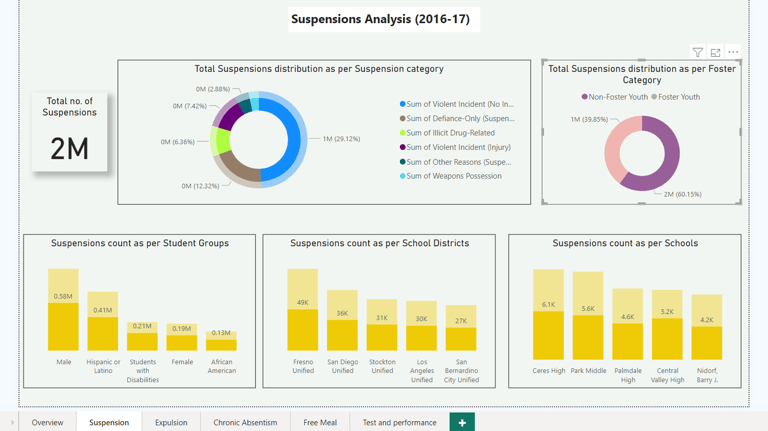
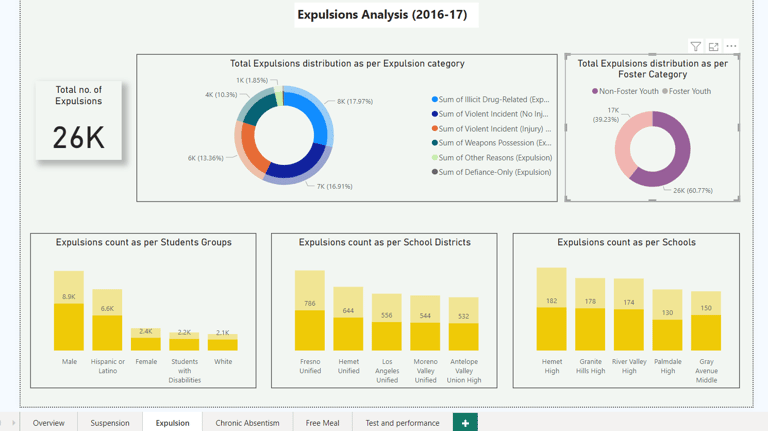
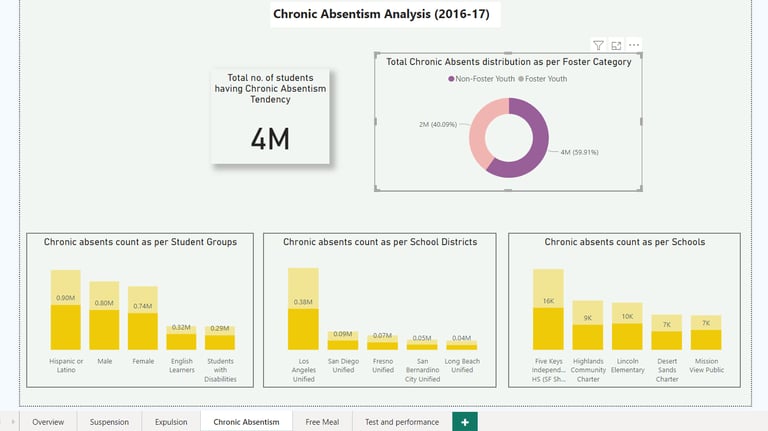
Welcome to the California School Project's PowerBI Dashboard Analysis. This comprehensive PowerBI dashboard offers an in-depth exploration of student disciplinary actions, encompassing expulsions, suspensions, and academic performance data for the academic year 2016-2017. The purpose of this dashboard is to provide educators and administrators with valuable insights into the correlation between disciplinary actions and academic outcomes. Through interactive visualizations and data-driven analysis, this tool aids in identifying trends and patterns, ultimately facilitating informed interventions to enhance both student behavior and academic achievements.

Problem Statement

The PowerBI dashboard addresses the need for a holistic understanding of student disciplinary actions and their impact on academic performance. By scrutinizing expulsions, suspensions, and exam scores throughout the 2016-2017 academic year, the dashboard empowers educational professionals to detect significant insights. The aim is to pinpoint periods of heightened disciplinary actions, recognize connections between behavior and academic achievement, and establish potential strategies for intervention. With these insights, educators can work towards fostering a positive learning environment that fosters student success on both behavioral and academic fronts.

PowerBI Analysis

The PowerBI dashboard showcases a range of interactive visualizations, empowering users to navigate disciplinary action and academic performance data with ease. By enabling users to explore trends, correlations, and comparative analyses, the dashboard enhances decision-making. Users can filter data by factors such as grade level, gender, and ethnicity, delving into nuanced insights. Through drill-down capabilities and report generation, this tool allows for detailed exploration and collaborative analysis, shaping data into actionable insights.

Recommendations

Based on the insights derived from the PowerBI dashboard, educators and administrators can take several strategic steps.

  • Firstly, identifying periods of escalated disciplinary actions can aid in allocating resources effectively to manage behavior.

  • Secondly, correlations between disciplinary actions and academic performance could illuminate the need for targeted support, such as counseling or academic interventions.

  • Thirdly, the ability to compare disciplinary actions and academic outcomes across different schools, districts, or student groups can highlight best practices and areas for improvement.

    Overall, these recommendations guide educators towards fostering a conducive learning environment that maximizes student potential.

Conclusion

In conclusion, the California School Project's PowerBI Dashboard Analysis is an invaluable tool for comprehending the intricate relationship between student disciplinary actions and academic performance. By harnessing the dashboard's interactive features, educators and administrators can uncover patterns, trends, and insights that drive effective interventions. Through collaborative analysis, this platform cultivates an environment where student behavior and academic achievements are intertwined components of educational success. As contributions to enhance the dashboard are welcomed, this project serves as an evolving resource for informed decision-making and improved student outcomes.

Project Git Repository